The post XLM Price Prediction For January 11 appeared first on Coinpedia Fintech News
After a continuous price decline, the cryptocurrency market seems to be recovering, and Stellar (XLM) appears to be regaining its bullish momentum. In the past three days, XLM has experienced a price decline of over 18% and has also broken through its crucial support level of $0.403.
XLM Bulls Back
However, with today’s upside momentum, XLM has returned to the support level and is poised for further gains. The potential reason for this price recovery across the crypto market, including XLM, is the upcoming inauguration of President-elect Donald Trump, scheduled for January 20, 2025.
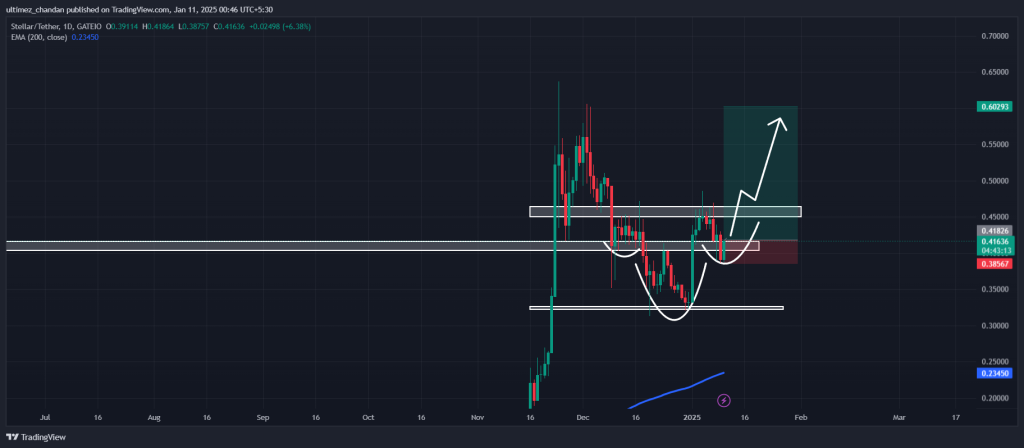
With this potential price recovery, the XLM daily chart has formed an ideal setup for traders looking to go long, with a perfect risk-to-reward ratio.
XLM Technical Analysis and Upcoming Levels
According to XLM’s daily chart, traders can see an attractive 1:5.6 risk-to-reward ratio, with a stop loss at $0.38 and a target at the $0.60 mark.
 Source: Trading View
If we delve deeper into the analysis, expert technical analysis suggests that XLM is forming a bullish inverted head-and-shoulders price action pattern on the daily time frame.
Based on the recent price action, if XLM closes its daily candle above the $0.415 mark, there is a strong possibility it could soar significantly and complete the speculated price action pattern.
Traders Over-Leveraged Positions
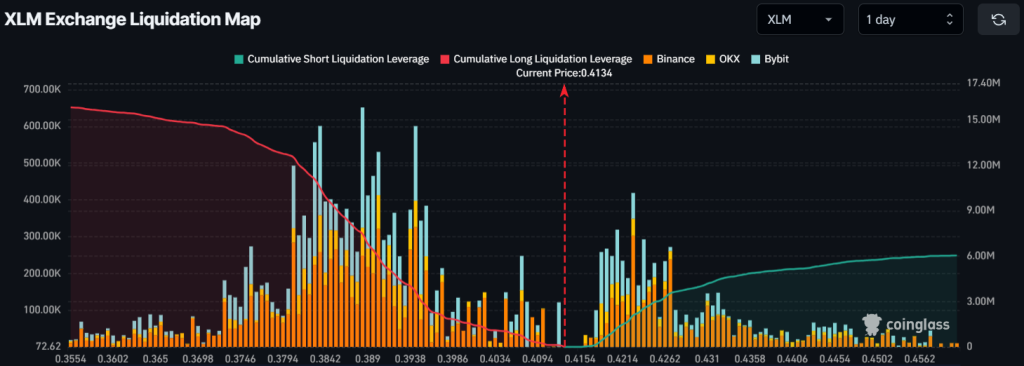
Looking at this bullish outlook, traders seem to be building long positions, as revealed by the on-chain analytics firm Coinglass.
 Source: Coinglass
According to the data, the major liquidation level on the lower side is $0.388, where traders have held significant long positions worth $7.47 million. However, $0.422 is another major liquidation area where short sellers have built over $2.09 million worth of short positions.
These levels are areas where traders are over-leveraged and have the potential to be liquidated if the price shifts to either level.
Current Price Momentum
Currently, XLM is trading near $0.418 and has witnessed a price surge of over 4.5% in upside momentum. However, during the same period, its trading volume has also increased, indicating heightened participation from traders and investors.


